Teva Reports Third Quarter 2022 Financial Results
Key financial highlights and outlook
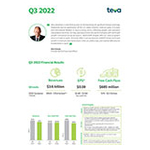

- Revenues of $3.6 billion
- GAAP diluted EPS of $0.05
- Non-GAAP diluted EPS of $0.59
- Cash flow generated from operating activities of $543 million
- Free cash flow of $685 million
-
2022 revenues outlook revised mainly due to continued foreign exchange headwinds; non-GAAP tax rate outlook range revised to 12% - 14%; operating income, Adjusted EBITDA, EPS and free cash flow reaffirmed:
- Revenues of $14.8 - $15.4 billion vs. previous range of $15.0 - $15.6 billion
- Adjusted EBITDA of $4.7 - $5.0 billion
- Non-GAAP diluted EPS of $2.40 - $2.60
- Free cash flow of $1.9 - $2.2 billion
- Non-GAAP tax rate of 12% - 14% vs. previous range of 13%-14%
TEL AVIV, Israel--(BUSINESS WIRE)--Teva Pharmaceutical Industries Ltd. (NYSE and TASE: TEVA) today reported results for the quarter ended September 30, 2022.
Mr. Kåre Schultz, Teva's President and CEO: "Teva delivered a solid third quarter on the backdrop of significant foreign exchange headwinds due to appreciation of the U.S. dollar. Generics revenues grew in Europe and International Markets in local currency terms, reflecting market growth and successful new product launches. Our key specialty brands also performed well, with continued growth momentum across all regions - AUSTEDO® showed 30% U.S. revenue growth and is on track to reach ~$1 billion 2022 annual revenues. AJOVY® shows continued growth in revenues and market share in U.S. and Europe, and reached 28% volume market share in Japan.”
Opioid Litigation Updates: Substantial progress toward a nationwide settlement
- In July 2022, the parties reached an agreement in principle on the financial terms of a nationwide settlement similar in structure to the nationwide settlements of other defendants.
- During the third quarter of 2022, Teva, the working group of States’ Attorneys General and the Multi-District Litigation Plaintiffs’ Executive Committee made substantial progress toward finalizing the non-financial terms of the proposed nationwide settlement agreement.
- Teva and Allergan have resolved their dispute with respect to Teva's indemnification obligations.
- Teva has also reached an agreement in principle with the Attorney General of New York that settles the state’s and its subdivisions’ opioid-related claims. We have updated the reserve to account for the premium.
- Immediately following the finalization of the documentation for the nationwide settlement agreement, the sign-on process for states will begin, followed by a similar sign-on process for the states’ subdivisions and special districts. Given the high participation rate in other nationwide opioids settlements and Teva’s settlements with Florida, Louisiana, Rhode Island, Texas, West Virginia and San Francisco and agreement in principle with New York, we remain optimistic that we will see a high participation rate in this nationwide settlement, enabling us to put these cases behind us and continue to focus on the patients we serve every day.
Third Quarter 2022 Consolidated Results
Revenues in the third quarter of 2022 were $3,595 million, a decrease of 8% compared to the third quarter of 2021. In local currency terms, revenues decreased by 2%, mainly due to a decrease in revenues from generic products in our North America segment, COPAXONE® in our North America and Europe segments, and BENDEKA® and TREANDA® in our North America segment, partially offset by higher revenues from AUSTEDO in our North America segment and generic products in our Europe segment.
Exchange rate movements during the third quarter of 2022, net of hedging effects, negatively impacted our revenues by $215 million compared to the third quarter of 2021. Exchange rate movements during the third quarter of 2022, net of hedging effects, negatively impacted our GAAP and non-GAAP operating income by $53 million and $58 million, respectively, compared to the third quarter of 2021.
GAAP gross profit was $1,669 million in the third quarter of 2022, a decrease of 7% compared to the third quarter of 2021. GAAP gross profit margin was 46.4% in the third quarter of 2022, compared to 46.2% in the third quarter of 2021. This increase was mainly driven by higher revenues from AUSTEDO, a favorable mix of generic products in our Europe segment, and higher revenues from the positive impact of hedging activities, partially offset mainly by higher operational costs due to macroeconomic headwinds and lower revenues from COPAXONE. Non-GAAP gross profit was $1,906 million in the third quarter of 2022, a decrease of 9% compared to the third quarter of 2021. Non-GAAP gross profit margin was 53.0% in the third quarter of 2022, compared to 53.6% in the third quarter of 2021. This decrease was mainly driven by higher operational costs due to macroeconomic headwinds and lower revenues from COPAXONE, partially offset by higher revenues from AUSTEDO, a favorable mix of generic products in our Europe segment and higher revenues from the positive impact of hedging activities.
GAAP Research and Development (R&D) expenses in the third quarter of 2022 were $175 million or 4.9% of quarterly revenues, a decrease of 21%, compared to $222 million, or 5.7% of quarterly revenues in the third quarter of 2021. Non-GAAP R&D expenses were $171 million, or 4.8% of quarterly revenues, in the third quarter of 2022, compared to $217 million, or 5.6%, in the third quarter of 2021. In the third quarter of 2022, our R&D expenses related primarily to specialty product candidates in neuroscience (such as migraine, movement disorders/ neurodegeneration and neuropsychiatry, including post-approval commitments), immunology (such as respiratory medicines) and selected other areas, as well as generic products and biosimilars. Our lower R&D expenses in the third quarter of 2022, compared to the third quarter of 2021, were mainly due to a decrease in neuroscience (in the pain and migraine and headache therapeutic areas) and immunology (in the respiratory therapeutic area) as well as various generics projects, and an adjustment in payments pursuant to a contract with one of our R&D partners in the third quarter of 2022, partially offset by higher R&D expenses related to our biosimilar products pipeline.
GAAP Selling and Marketing (S&M) expenses in the third quarter of 2022 were $539 million, a decrease of 10% compared to the third quarter of 2021. Non-GAAP S&M expenses were $510 million, or 14.2% of quarterly revenues, in the third quarter of 2022, compared to $567 million, or 14.6%, in the third quarter of 2021.
GAAP General and Administrative (G&A) expenses in the third quarter of 2022 were $283 million, a decrease of 3% compared to the third quarter of 2021. Non-GAAP G&A expenses were $250 million, or 7.0% of quarterly revenues, in the third quarter of 2022, compared to $275 million, or 7.1%, in the third quarter of 2021.
GAAP other income in the third quarter of 2022 was $2 million, compared to $25 million in the third quarter of 2021. Non-GAAP other income in the third quarter of 2022 was $2 million, compared to $18 million in the third quarter of 2021.
GAAP operating income in the third quarter of 2022 was $419 million, compared to $623 million in the third quarter of 2021. The decrease in operating income in the third quarter of 2022 compared to the third quarter of 2021 was mainly due to legal settlements and loss contingencies as well as lower gross profit, partially offset by lower S&M and R&D expenses. Non-GAAP operating income in the third quarter of 2022 was $977 million, a decrease of 6%, compared to $1,042 million in the third quarter of 2021. This decrease in non-GAAP operating income was mainly due to lower gross profit, as discussed above. Non-GAAP operating margin was 27.2% in the third quarter of 2022, compared to 26.8% in the third quarter of 2021 mainly due to lower S&M and R&D expenses, partially offset by lower gross margin.
Adjusted EBITDA was $1,089 million in the third quarter of 2022, a decrease of 7% compared to $1,170 million in the third quarter of 2021.
GAAP financial expenses, net were $252 million in the third quarter of 2022, compared to $241 million in the third quarter of 2021. Non-GAAP financial expenses, net were $238 million in the third quarter of 2022, compared to $235 million in the third quarter of 2021. Financial expenses in the third quarters of 2022 and 2021 were mainly comprised of interest expenses of $230 million and $232 million, respectively.
In the third quarter of 2022, we recognized a GAAP tax expense of $107 million, on pre-tax income of $166 million. In the third quarter of 2021, we recognized a tax expense of $76 million, on pre-tax income of $382 million. Non-GAAP income taxes in the third quarter of 2022 were $74 million, or 10%, on pre-tax non-GAAP income of $739 million. Non-GAAP income taxes in the third quarter of 2021 were $137 million, or 17%, on pre-tax non-GAAP income of $807 million. Our non-GAAP tax rate in the third quarter of 2022 was mainly affected by the mix of products we sold, interest expense disallowances and adjustments to valuation allowances on deferred tax assets.
We expect our annual non-GAAP tax rate for 2022 to be 12%-14%, lower than our non-GAAP tax rate for 2021, which was 16.4%, mainly due to the effect of a portion of the realization of losses related to an investment in one of our U.S. subsidiaries.
GAAP net income attributable to Teva and GAAP diluted earnings per share were $56 million and $0.05, respectively, in the third quarter of 2022, compared to net income of $292 million and diluted earnings per share of $0.26 in the third quarter of 2021. The decrease in net income in the third quarter of 2022 was mainly due to lower operating income and higher income taxes, as discussed above. Non-GAAP net income attributable to Teva and non-GAAP diluted earnings per share in the third quarter of 2022 were $658 million and $0.59, respectively, compared to $651 million and $0.59 in the third quarter of 2021.
The weighted average diluted shares outstanding used for the fully diluted share calculation for the three months ended September 30, 2022 and 2021 were 1,119 million and 1,109 million shares, respectively. The weighted average diluted shares outstanding used for the fully diluted share calculation on a non-GAAP basis for the three months ended September 30, 2022 and 2021 was 1,119 million and 1,109 million shares, respectively.
As of September 30, 2022 and 2021, the fully diluted share count for purposes of calculating our market capitalization was approximately 1,144 million and 1,128 million shares, respectively.
Non-GAAP information: Net non-GAAP adjustments in the third quarter of 2022 were $602 million. Non-GAAP net income and non-GAAP EPS for the third quarter of 2022 were adjusted to exclude the following items:
- Legal settlements and loss contingencies of $195 million;
- Amortization of purchased intangible assets of $165 million, of which $145 million is included in cost of sales and the remaining $20 million in S&M expenses;
- Accelerated depreciation of $45 million;
- Impairment of long-lived assets of $28 million;
- Equity compensation expenses of $26 million;
- Restructuring expenses of $25 million;
- Finance expenses of $14 million;
- Contingent consideration expense of $6 million;
- Costs related to regulatory actions taken in facilities of $2 million;
- Other non-GAAP items of $68 million;
- Items attributable to non-controlling interests of $4 million; and
- Tax expense of $33 million.
Teva believes that excluding such items facilitates investors’ understanding of its business.
Commencing the first quarter of 2022, we no longer exclude IPR&D acquired in development arrangements from our non-GAAP financial measures. In our comparable non-GAAP financial measures for the third quarter of 2021, no IPR&D acquired in development arrangements was recorded. We have made this change to our presentation of non-GAAP financial measures to improve comparability of our non-GAAP presentation to those of other companies in the pharmaceutical industry that made a similar change to their presentations beginning in the first quarter of 2022.
For further information, see the tables below for a reconciliation of the U.S. GAAP results to the adjusted non-GAAP figures and the information under “Non-GAAP Financial Measures.” Investors should consider non-GAAP financial measures in addition to, and not as replacement for, or superior to, measures of financial performance prepared in accordance with GAAP.
Cash flow generated from operating activities during the third quarter of 2022 was $543 million, compared to $529 million in the third quarter of 2021. The increase in the third quarter of 2022 resulted mainly from changes in the deferred purchase price under our securitization agreement, partially offset by changes in working capital items, primarily a lower reduction in our inventory levels compared to the third quarter of 2021.
Free cash flow (defined as cash flow generated from operating activities, cash used for capital investments, beneficial interest collected in exchange for securitized accounts receivables, proceeds from divestitures of businesses and other assets and cash used for acquisition of businesses, net of cash acquired) was $685 million in the third quarter of 2022, compared to $795 million in the third quarter of 2021. This decrease in the third quarter of 2022 resulted mainly from changes in working capital items, primarily a lower reduction in our inventory levels compared to the third quarter of 2021.
As of September 30, 2022, our debt was $21,266 million, compared to $23,043 million as of December 31, 2021. This decrease was mainly due to $1,139 million from exchange rate fluctuations and $661 million senior notes repaid at maturity. Our debt as of September 30, 2022 was effectively denominated in the following currencies: 65% in U.S. dollars, 33% in euros and 2% in Swiss francs. The portion of total debt classified as short-term as of September 30, 2022 was 13%, compared to 6% as of December 31, 2021. Our financial leverage, which is the ratio between our debt and the sum of our debt and equity, was 69% as of September 30, 2022, compared to 67% as of December 31, 2021. Our average debt maturity was approximately 5.9 years as of September 30, 2022, compared to 6.4 years as of December 31, 2021.
Segment Results for the third Quarter of 2022
North America Segment
Our North America segment includes the United States and Canada.
The following table presents revenues, expenses and profit for our North America segment for the three months ended September 30, 2022 and 2021:
|
|
|
|
|
|
|
|
|
Three months ended September 30, |
||||||
|
2022 |
|
2021 |
||||
|
(U.S. $ in millions / % of Segment Revenues) |
||||||
Revenues |
$ |
1,809 |
100% |
$ |
1,875 |
100% |
|
Gross profit |
|
942 |
52.1% |
|
967 |
51.6% |
|
R&D expenses |
|
111 |
6.1% |
|
146 |
7.8% |
|
S&M expenses |
|
232 |
12.8% |
|
250 |
13.3% |
|
G&A expenses |
|
122 |
6.8% |
|
121 |
6.4% |
|
Other income |
|
§ |
§ |
|
(7) |
§ |
|
Segment profit* |
$ |
477 |
26.3% |
$ |
458 |
24.4% |
|
|
|
|
|
|
|
|
|
* Segment profit does not include amortization and certain other items. § Represents an amount less than $0.5 million or 0.5%, as applicable. |
|||||||
Revenues from our North America segment in the third quarter of 2022 were $1,809 million, a decrease of $66 million, or 4%, compared to the third quarter of 2021, mainly due to a decrease in revenues from generic products, COPAXONE and BENDEKA and TREANDA, partially offset by higher revenues from AUSTEDO.
On October 1, 2022, we discontinued marketing ProAir® HFA, while focusing our marketing efforts on albuterol sulfate inhalation aerosol (our ProAir authorized generic) and ProAir Digihaler® (albuterol sulfate 117 mcg). ProAir HFA and ProAir Digihaler results are included in “Other” in the revenues table below, and were not material during the third quarter of 2022.
Revenues in the United States, our largest market, were $1,685 million in the third quarter of 2022, a decrease of $69 million or 4% compared to the third quarter of 2021.
Revenues by Major Products and Activities
The following table presents revenues for our North America segment by major products and activities for the three months ended September 30, 2022 and 2021:
|
|
Three months ended
|
|
Percentage
|
||||
|
|
2022 |
|
2021 |
|
2022-2021 |
||
|
|
(U.S. $ in millions) |
|
|
||||
|
|
|
|
|
|
|
|
|
Generic products |
|
$ |
806 |
|
$ |
859 |
|
(6%) |
AJOVY |
|
|
57 |
|
|
46 |
|
23% |
AUSTEDO |
|
|
260 |
|
|
201 |
|
30% |
BENDEKA/TREANDA |
|
|
77 |
|
|
95 |
|
(20%) |
COPAXONE |
|
|
105 |
|
|
133 |
|
(21%) |
Anda |
|
|
371 |
|
|
363 |
|
2% |
Other |
|
|
133 |
|
|
178 |
|
(25%) |
Total |
|
$ |
1,809 |
|
$ |
1,875 |
|
(4%) |
Generic products revenues in our North America segment (including biosimilars) in the third quarter of 2022 were $806 million, a decrease of 6% compared to the third quarter of 2021, mainly due to increased competition.
In the third quarter of 2022, our total prescriptions were approximately 303 million (based on trailing twelve months), representing 8.2% of total U.S. generic prescriptions according to IQVIA data.
AJOVY revenues in our North America segment in the third quarter of 2022 increased by 23% to $57 million, compared to the third quarter of 2021, mainly due to growth in volume. In the third quarter of 2022, AJOVY’s exit market share in the United States in terms of total number of prescriptions was 25% compared to 21% in the third quarter of 2021.
AUSTEDO revenues in our North America segment in the third quarter of 2022 increased by 30%, to $260 million, compared to $201 million in the third quarter of 2021, mainly due to growth in volume.
BENDEKA and TREANDA combined revenues in our North America segment in the third quarter of 2022 decreased by 20% to $77 million, compared to the third quarter of 2021, mainly due to the availability of alternative therapies and intense competition in anticipation of the orphan drug exclusivity expiration in December 2022.
COPAXONE revenues in our North America segment in the third quarter of 2022 decreased by 21% to $105 million, compared to the third quarter of 2021, mainly due to generic competition in the United States and a decrease in glatiramer acetate market share due to availability of alternative therapies.
Anda revenues in our North America segment in the third quarter of 2022 increased by 2% to $371 million, compared to $363 million in the third quarter of 2021, mainly due to higher demand.
North America Gross Profit
Gross profit from our North America segment in the third quarter of 2022 was $942 million, a decrease of 3%, compared to $967 million in the third quarter of 2021.
Gross profit margin for our North America segment in the third quarter of 2022 increased to 52.1%, compared to 51.6% in the third quarter of 2021. This increase was mainly due to a favorable change in the mix of products.
North America Profit
Profit from our North America segment consists of gross profit less R&D expenses, S&M expenses, G&A expenses and any other income related to this segment. Segment profit does not include amortization and certain other items.
Profit from our North America segment in the third quarter of 2022 was $477 million, an increase of 4% compared to $458 million in the third quarter of 2021, mainly due to a favorable change in the mix of products, cost efficiencies and lower R&D expenses, as discussed above.
Europe Segment
Our Europe segment includes the European Union, the United Kingdom, and certain other European countries.
The following table presents revenues, expenses and profit for our Europe segment for the three months ended September 30, 2022 and 2021:
|
Three months ended September 30, |
|||||
|
2022 |
|
2021 |
|||
|
(U.S. $ in millions / % of Segment Revenues) |
|||||
Revenues |
$ |
1,069 |
100% |
$ |
1,220 |
100% |
Gross profit |
|
634 |
59.3% |
|
714 |
58.6% |
R&D expenses |
|
44 |
4.1% |
|
55 |
4.5% |
S&M expenses |
|
169 |
15.8% |
|
204 |
16.7% |
G&A expenses |
|
61 |
5.7% |
|
64 |
5.2% |
Other income |
|
§ |
§ |
|
(2) |
§ |
Segment profit* |
$ |
360 |
33.7% |
$ |
394 |
32.3% |
___________ |
|
|
|
|
|
|
* Segment profit does not include amortization and certain other items. § Represents an amount less than $0.5 million or 0.5%, as applicable. |
||||||
Revenues from our Europe segment in the third quarter of 2022 were $1,069 million, a decrease of 12%, or $151 million, compared to the third quarter of 2021. In local currency terms, revenues increased by 1%, mainly due to higher demand for generic products, together with higher revenues from generic product launches. In the third quarter of 2022, our revenues were negatively impacted by exchange rate fluctuations of $162 million, net of hedging effects, compared to the third quarter of 2021. Revenues in the third quarter of 2022 included $24 million from a positive hedging impact, which is included in “Other” in the table below.
Revenues by Major Products and Activities
The following table presents revenues for our Europe segment by major products and activities for the three months ended September 30, 2022 and 2021:
|
|
Three months ended
|
|
Percentage
|
||||
|
|
2022 |
|
2021 |
|
2022-2021 |
||
|
|
(U.S. $ in millions) |
|
|
||||
Generic products |
|
$ |
803 |
|
$ |
895 |
|
(10%) |
AJOVY |
|
|
30 |
|
|
23 |
|
31% |
COPAXONE |
|
|
63 |
|
|
95 |
|
(34%) |
Respiratory products |
|
|
62 |
|
|
85 |
|
(27%) |
Other |
|
|
111 |
|
|
122 |
|
(9%) |
Total |
|
$ |
1,069 |
|
$ |
1,220 |
|
(12%) |
|
|
|
|
|
|
|
|
|
Generic products revenues (including OTC and biosimilar products) in our Europe segment in the third quarter of 2022, decreased by 10% to $803 million, compared to the third quarter of 2021. In local currency terms, revenues increased by 5%, mainly due to higher demand for generic and OTC products, together with higher revenues from generic product launches.
On August 29, 2022 the European Commission granted a marketing authorization for RANIVISIO® (ranibizumab), a biosimilar to Lucentis®, across all five indications in adults for which Lucentis® is authorized, including age-related macular degeneration (AMD) and four other ophthalmology indications.
AJOVY revenues in our Europe segment in the third quarter of 2022 increased to $30 million, compared to $23 million in the third quarter of 2021, mainly due to growth in European countries in which AJOVY had previously been launched, as well as launches and reimbursements in additional European countries.
COPAXONE revenues in our Europe segment in the third quarter of 2022 decreased by 34% to $63 million, compared to the third quarter of 2021. In local currency terms, revenues decreased by 23%, due to price reductions and a decline in volume resulting from competing glatiramer acetate products.
Respiratory products revenues in our Europe segment in the third quarter of 2022 decreased by 27% to $62 million compared to the third quarter of 2021. In local currency terms, revenues decreased by 15%, mainly due to net price reductions and lower volumes.
Europe Gross Profit
Gross profit from our Europe segment in the third quarter of 2022 was $634 million, a decrease of 11% compared to $714 million in the third quarter of 2021, mainly due to exchange rate fluctuations.
Gross profit margin for our Europe segment in the third quarter of 2022 increased to 59.3%, compared to 58.6% in the third quarter of 2021. This increase was mainly due to higher revenues from the positive impact of hedging activities discussed above, as well as lower cost of goods sold, mainly due to a better mix of products and decrease in write-offs.
Europe Profit
Profit from our Europe segment consists of gross profit less R&D expenses, S&M expenses, G&A expenses and any other income related to this segment. Segment profit does not include amortization and certain other items.
Profit from our Europe segment in the third quarter of 2022 was $360 million, a decrease of 8%, compared to $394 million in the third quarter of 2021. This decrease was mainly due to exchange rate fluctuations.
International Markets Segment
Our International Markets segment includes all countries in which we operate other than those in our North America and Europe segments. The countries in our International Markets segment include highly regulated, pure generic markets, such as Israel, branded generics-oriented markets, such as Russia and certain Latin America markets and hybrid markets, such as Japan.
Contacts
IR Contacts
Ran Meir (267) 468-4475
Yael Ashman +972 (3) 914 8262
PR Contacts
Kelley Dougherty (973) 832-2810
Eden Klein +972 (3) 906 2645
Read full story here
Editor Details
-
Company:
- Businesswire